

Urban mobility requires efficient, reliable, and scalable transit networks. Across metropolitan areas globally, traffic congestion and rising carbon emissions challenge traditional transit planning.
Bus Rapid Transit (BRT) systems bridge the gap between heavy rail performance and flexible bus routing. This guide explores BRT mechanics, operational strategies, and commuter benefits through empirical research and government data.
What is Bus Rapid Transit?
Bus Rapid Transit delivers rail-like transit services using rubber-tired buses. Planners integrate specialized infrastructure, advanced technology, and priority signaling into a unified network.
Unlike traditional bus routes caught in mixed traffic, BRT systems utilize dedicated running ways. This segregation prevents delays caused by private vehicles.

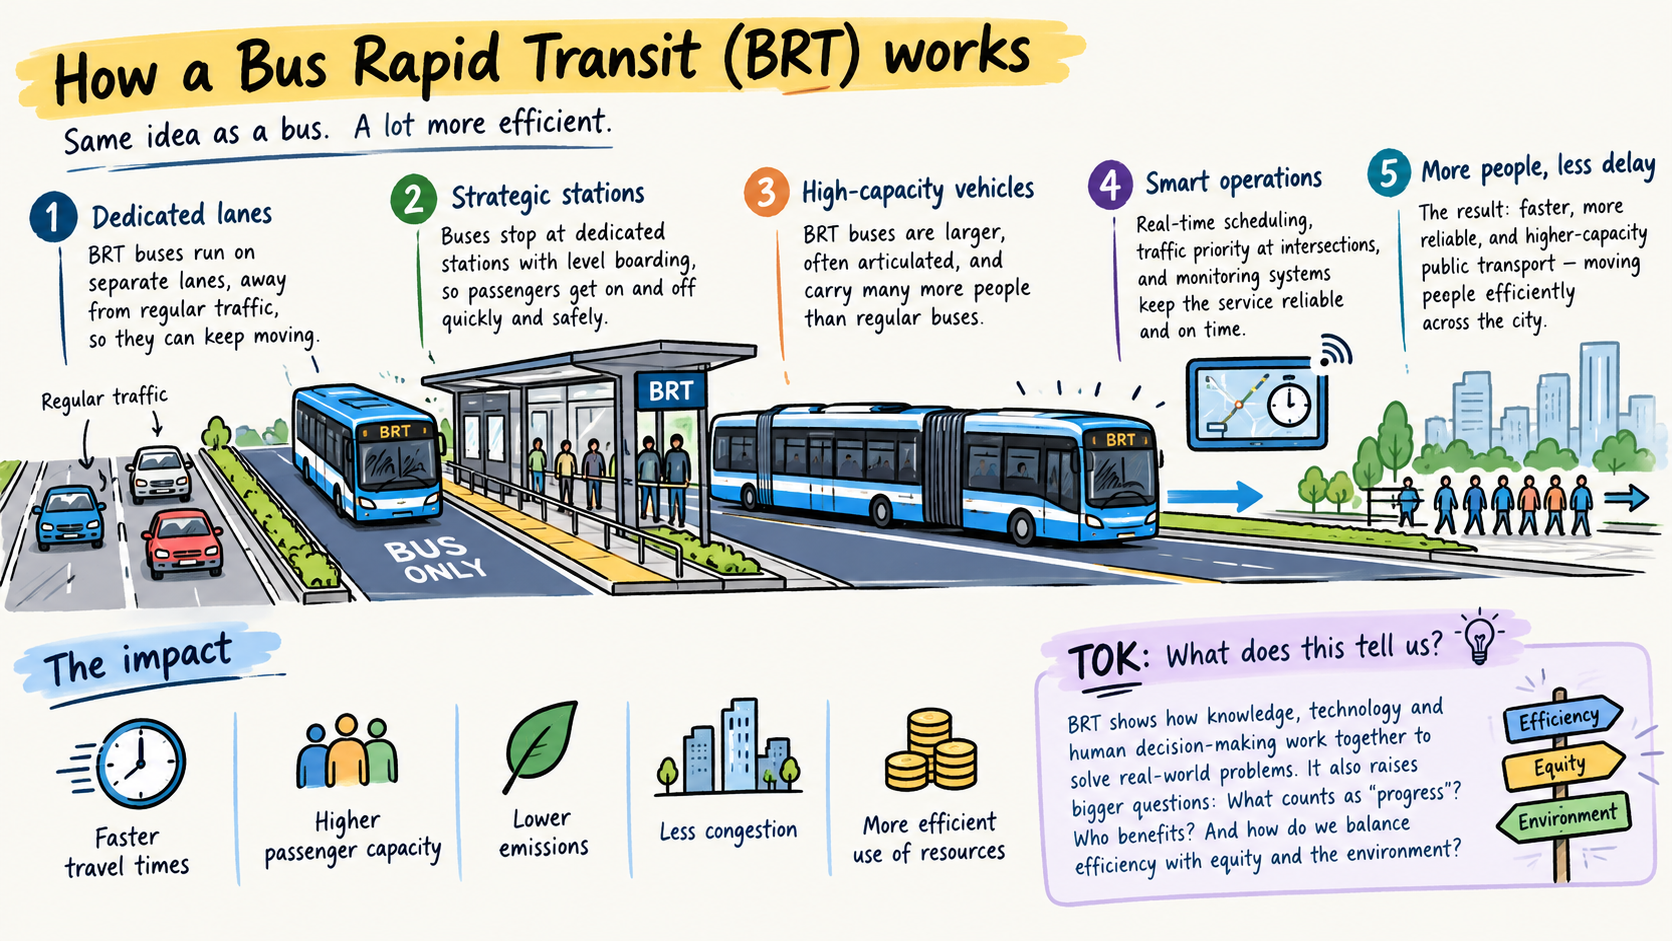
The Core Elements of BRT
- Dedicated Right-of-Way: Physical separation keeps buses out of traffic lanes.
- Bus Alignment: Center-lane running prevents delays from curbside parking and turning vehicles.
- Off-Board Fare Collection: Passengers pay before boarding to minimize station dwell times.
- Intersection Treatments: Traffic signal priority (TSP) grants green lights to approaching buses.
- Platform-Level Boarding: Stations match bus floor heights for rapid, accessible entry.
The Evolution and Impact of BRT
Curitiba, Brazil, pioneered modern BRT in the 1970s. Urban planners sought a high-capacity transit system without the immense capital costs of underground rail.
Today, cities worldwide implement these networks. BRT systems move large volumes of commuters at a fraction of the cost of subway construction.
“Bus Rapid Transit provides a high-quality public transport experience that is fast, comfortable, and cost-effective—matching the capabilities of rail transit at significantly lower capital investments.” — Institute for Transportation and Development Policy (ITDP)
Research demonstrates the tangible economic and environmental advantages of these networks. According to data published in the Federal Transit Administration (FTA) Reports, cities implementing dedicated BRT corridors experience notable shifts in modal split away from private automobiles.
BRT vs. Traditional Transit: A Comparative Analysis
Commuters often question how BRT compares to traditional bus networks and light rail.
| Metric | Traditional Bus | Bus Rapid Transit (BRT) | Light Rail Transit (LRT) |
|---|---|---|---|
| Capital Cost per Mile | Low ($1M – $5M) | Medium ($10M – $50M) | High ($50M – $150M+) |
| Implementation Speed | Immediate | Moderate (2–5 years) | Slow (5–10 years) |
| Average Speed | Low (8–12 mph) | High (18–25 mph) | High (20–30 mph) |
| Passenger Capacity | Low to Medium | High | High |
| Route Flexibility | High | Moderate | Low |
Studies from the Transportation Research Board (TRB) indicate that BRT systems achieve up to 70% of rail performance at roughly 10% to 25% of the infrastructure cost.
Understanding the BRT System: A Step-by-Step Commuter Guide
Riding a BRT system differs from boarding a standard local bus. Understanding the infrastructure helps commuters navigate the network efficiently.
1. Pre-Boarding Preparation
Commuters purchase tickets or validate smart cards at station turnstiles or platform kiosks before the vehicle arrives. This off-board system eliminates queuing inside the vehicle.
2. Station Arrival and Wayfinding
BRT stations resemble rail platforms. Electronic arrival boards display real-time tracking data supplied by General Transit Feed Specification (GTFS) feeds.
3. Precision Boarding
Sliding platform doors—similar to metro systems—open simultaneously with the bus doors. Level-boarding ramps eliminate steps, accommodating wheelchairs, strollers, and bicycles seamlessly.
4. In-Transit Experience
Onboard displays announce upcoming stops. Drivers focus on safe navigation while automated systems manage announcements and schedule adherence.
Quantitative Insights: Performance Statistics
Urban research institutions continually audit transit efficiency. Empirical data highlights the operational reliability of modern BRT corridors.
- Speed Increases: According to a study by the Mineta Transportation Institute (MTI), BRT systems increase average commercial speeds by 20% to 40% compared to local bus routes.
- Ridership Growth: Research published in the Journal of Public Transportation notes a 15% to 30% increase in corridor ridership within the first year of BRT implementation.
- Time Savings: Commuters save an average of 10 to 15 minutes per one-way trip on fully integrated BRT corridors.
Unique Insights: The Hidden Mechanics of BRT
Urban mobility experts look beyond surface-level amenities to understand what makes BRT successful. Two critical components drive network performance behind the scenes:
Transit Signal Priority (TSP) Algorithms
Advanced BRT networks use transponders and cellular communication to talk to city traffic lights. When a bus falls behind schedule, the traffic signal extends green phases or shortens red phases. This minimizes kinetic energy loss from stopping and restarting heavy vehicles.
Land-Use Integration and TOD
According to urban planning studies from Columbia University’s Center for Sustainable Urban Development (CSUD), high-quality BRT stimulates Transit-Oriented Development (TOD). Municipalities often rezone corridors for mixed-use, high-density developments. This spatial strategy ensures a steady baseline of ridership throughout the day, avoiding purely peak-hour commuter strains.
Frequently Asked Questions
1. How does BRT differ from a standard bus lane?
Standard bus lanes typically operate during peak hours and share space with turning traffic or delivery vehicles. True BRT systems utilize permanent, physically separated running ways, specialized stations, off-board fare collection, and signal priority to ensure uninterrupted travel times.
2. Are BRT systems accessible for passengers with disabilities?
Yes. BRT stations feature raised platforms that align flush with the bus floor. This design removes steps, allowing passengers using mobility devices, wheelchairs, or strollers to roll directly onto the vehicle without deployment ramps.
3. How do off-board fare collection systems work?
Passengers pay fares at station ticket machines or tap smart cards at platform gates before boarding. This process distributes fare collection across all doors simultaneously, reducing station dwell times and keeping vehicles on schedule.
4. Can BRT handle high passenger volumes during peak hours?
Yes. BRT systems deploy high-capacity articulated or bi-articulated buses. Combined with high-frequency headways (buses arriving every 2 to 5 minutes) and rapid off-board boarding, BRT corridors can transport upwards of 15,000 to 20,000 passengers per hour per direction.
5. Where can I find official performance data on BRT networks?
Commuters and researchers can review comprehensive data, safety records, and federal funding evaluations through the National Transit Database (NTD), maintained by the Federal Transit Administration.


